


Part II of a four-part series on Harvard’s incoming Class of 2017, based on data collected by The Crimson in an online survey conducted in the month of August. Part I ran on Tuesday, Part III ran on Thursday, and Part IV will run on Friday.
In Harvard Yard, 14 percent are the 1 percent. In a Crimson survey of the Class of 2017, about 14 percent of incoming freshmen said they come from families with reported incomes above $500,000 a year, putting them among the top roughly 1 percent of earners in the United States.
More than half of Harvard freshmen reported coming from households that make more than $125,000 a year. In comparison, the median household income in America is just over $50,000, according to recent U.S. Census data.
This year Harvard reported that it will spend $182 million on undergraduate financial aid. But even given need blind admissions and Harvard’s expansive financial aid program, survey results suggest that Harvard freshmen still disproportionately represent America’s economic elite.
The Crimson conducted its email survey of the freshman class from Aug. 5 to Aug. 28. A total of 1,311 incoming students responded—nearly 80 percent of the Class of 2017—although not all of them finished the survey. Part II of a four-part series on the survey’s results looks at statistics related to admissions, financial aid, and athletic recruiting.
ADMISSIONS BY THE NUMBERS
Eighty-one percent of freshman respondents said they are at their first choice college. On average, freshmen applied to 6.57 schools, and were accepted to 4.68.
Two students reported applying to a class-high 25 schools. The highest number of reported acceptances was 24.
Overall, about 50 percent of respondents said that they were accepted to Harvard early, in line with statistics released by the College.
On average, freshman respondents took the SAT 1.85 times, earning an average highest composite score of 2237. Students were more likely to take the SAT, and most respondents never took the ACT.
Standardized test scores varied along racial lines. East Asian and Indian respondents reported SAT averages of 2299, the two highest of the seven ethnic groups considered in the survey. Respondents who identified as Black and Native American reported the lowest average scores, 2107 and 2142, respectively.
Respondents’ highest SAT scores tended to go up with an increase in income bracket. Of the six income brackets represented in the survey, respondents who reported household incomes of more than $500,000 or between $250,000 and $500,000 earned the highest average SAT composite scores.
INCOME AND ADMISSIONS
When Harvard announced that it would eliminate early action in 2007, then-President Derek C. Bok argued that early action programs “advantage the advantaged.” With the program now reinstated, the numbers suggest that this concern could still be justified.
Respondents from the two highest income categories were more likely to say they had been admitted early. Meanwhile, respondents from the two lowest income categories were underrepresented among early action admits.
Read more in College News
Freshman Survey Part I: Meet Harvard's Class of 2017Recommended Articles
-
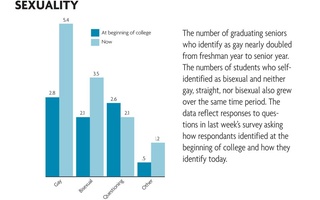 Sexuality
 -
Psych Study Determines Language Affects Test ResultsThe language used to conduct psychological tests might need be reexamined, Harvard researchers say.
-
 Freshman Survey Part IV: Sex, Drugs, and MacBook Pros
 -
 The Final Club Party: Who’s There and What’s Going On?
 -
 Final Clubs: Love ’Em or Leave ’Em?
 -
 Women, Minority Faculty Members Report Worse Climate Than Men, Non-Minorities


